Observability
Tracing
Use tracing to debug and optimize query performance.
Chalk provides traces for online queries, enabling customers to identify performance bottlenecks and effectively optimize their low-latency queries. Chalk’s traces break down every function call—from feature computation to data retrieval—showing where time is spent and why. Easily write, deploy, and tune high-performance ML applications with Chalk.
Chalk’s tracing is built on OpenTelemetry standards, ensuring compatibility with existing telemetry systems and future extensibility. Traces are stored in a ClickHouse database deployed within your Kubernetes cluster and viewable via the query pages in the Chalk dashboard. Chalk, by default, sets a TTL of 7 days for trace data, but will adjust this automatically as storage limits are approached.
Enabling Traces
Tracing is typically enabled by default in Chalk environments. In order to fetch a trace for an online query, you can either add a flag at query time or set environment variables for environment-wide configurations.
Requirements
To use tracing features, please ensure that you add the following Python dependency
chalkpy[tracing]
This links required peer dependencies for OpenTelemetry tracing:
opentelemetry-apiopentelemetry-sdk
Please note that tracing is not fully supported in the python client until version chalkpy>=2.95.9
Query-time traces
To fetch a trace for a specific online query, you can use the --trace flag in the Chalk CLI:
chalk query --in customer.id=123 --out customer.num_recent_transactions --traceYou can also specify a trace flag in your ChalkClient call:
from chalk import ChalkClient
ChalkClient().query(
input={"customer.id": 123},
output=["customer.avg_recent_transactions_amt"],
trace=True
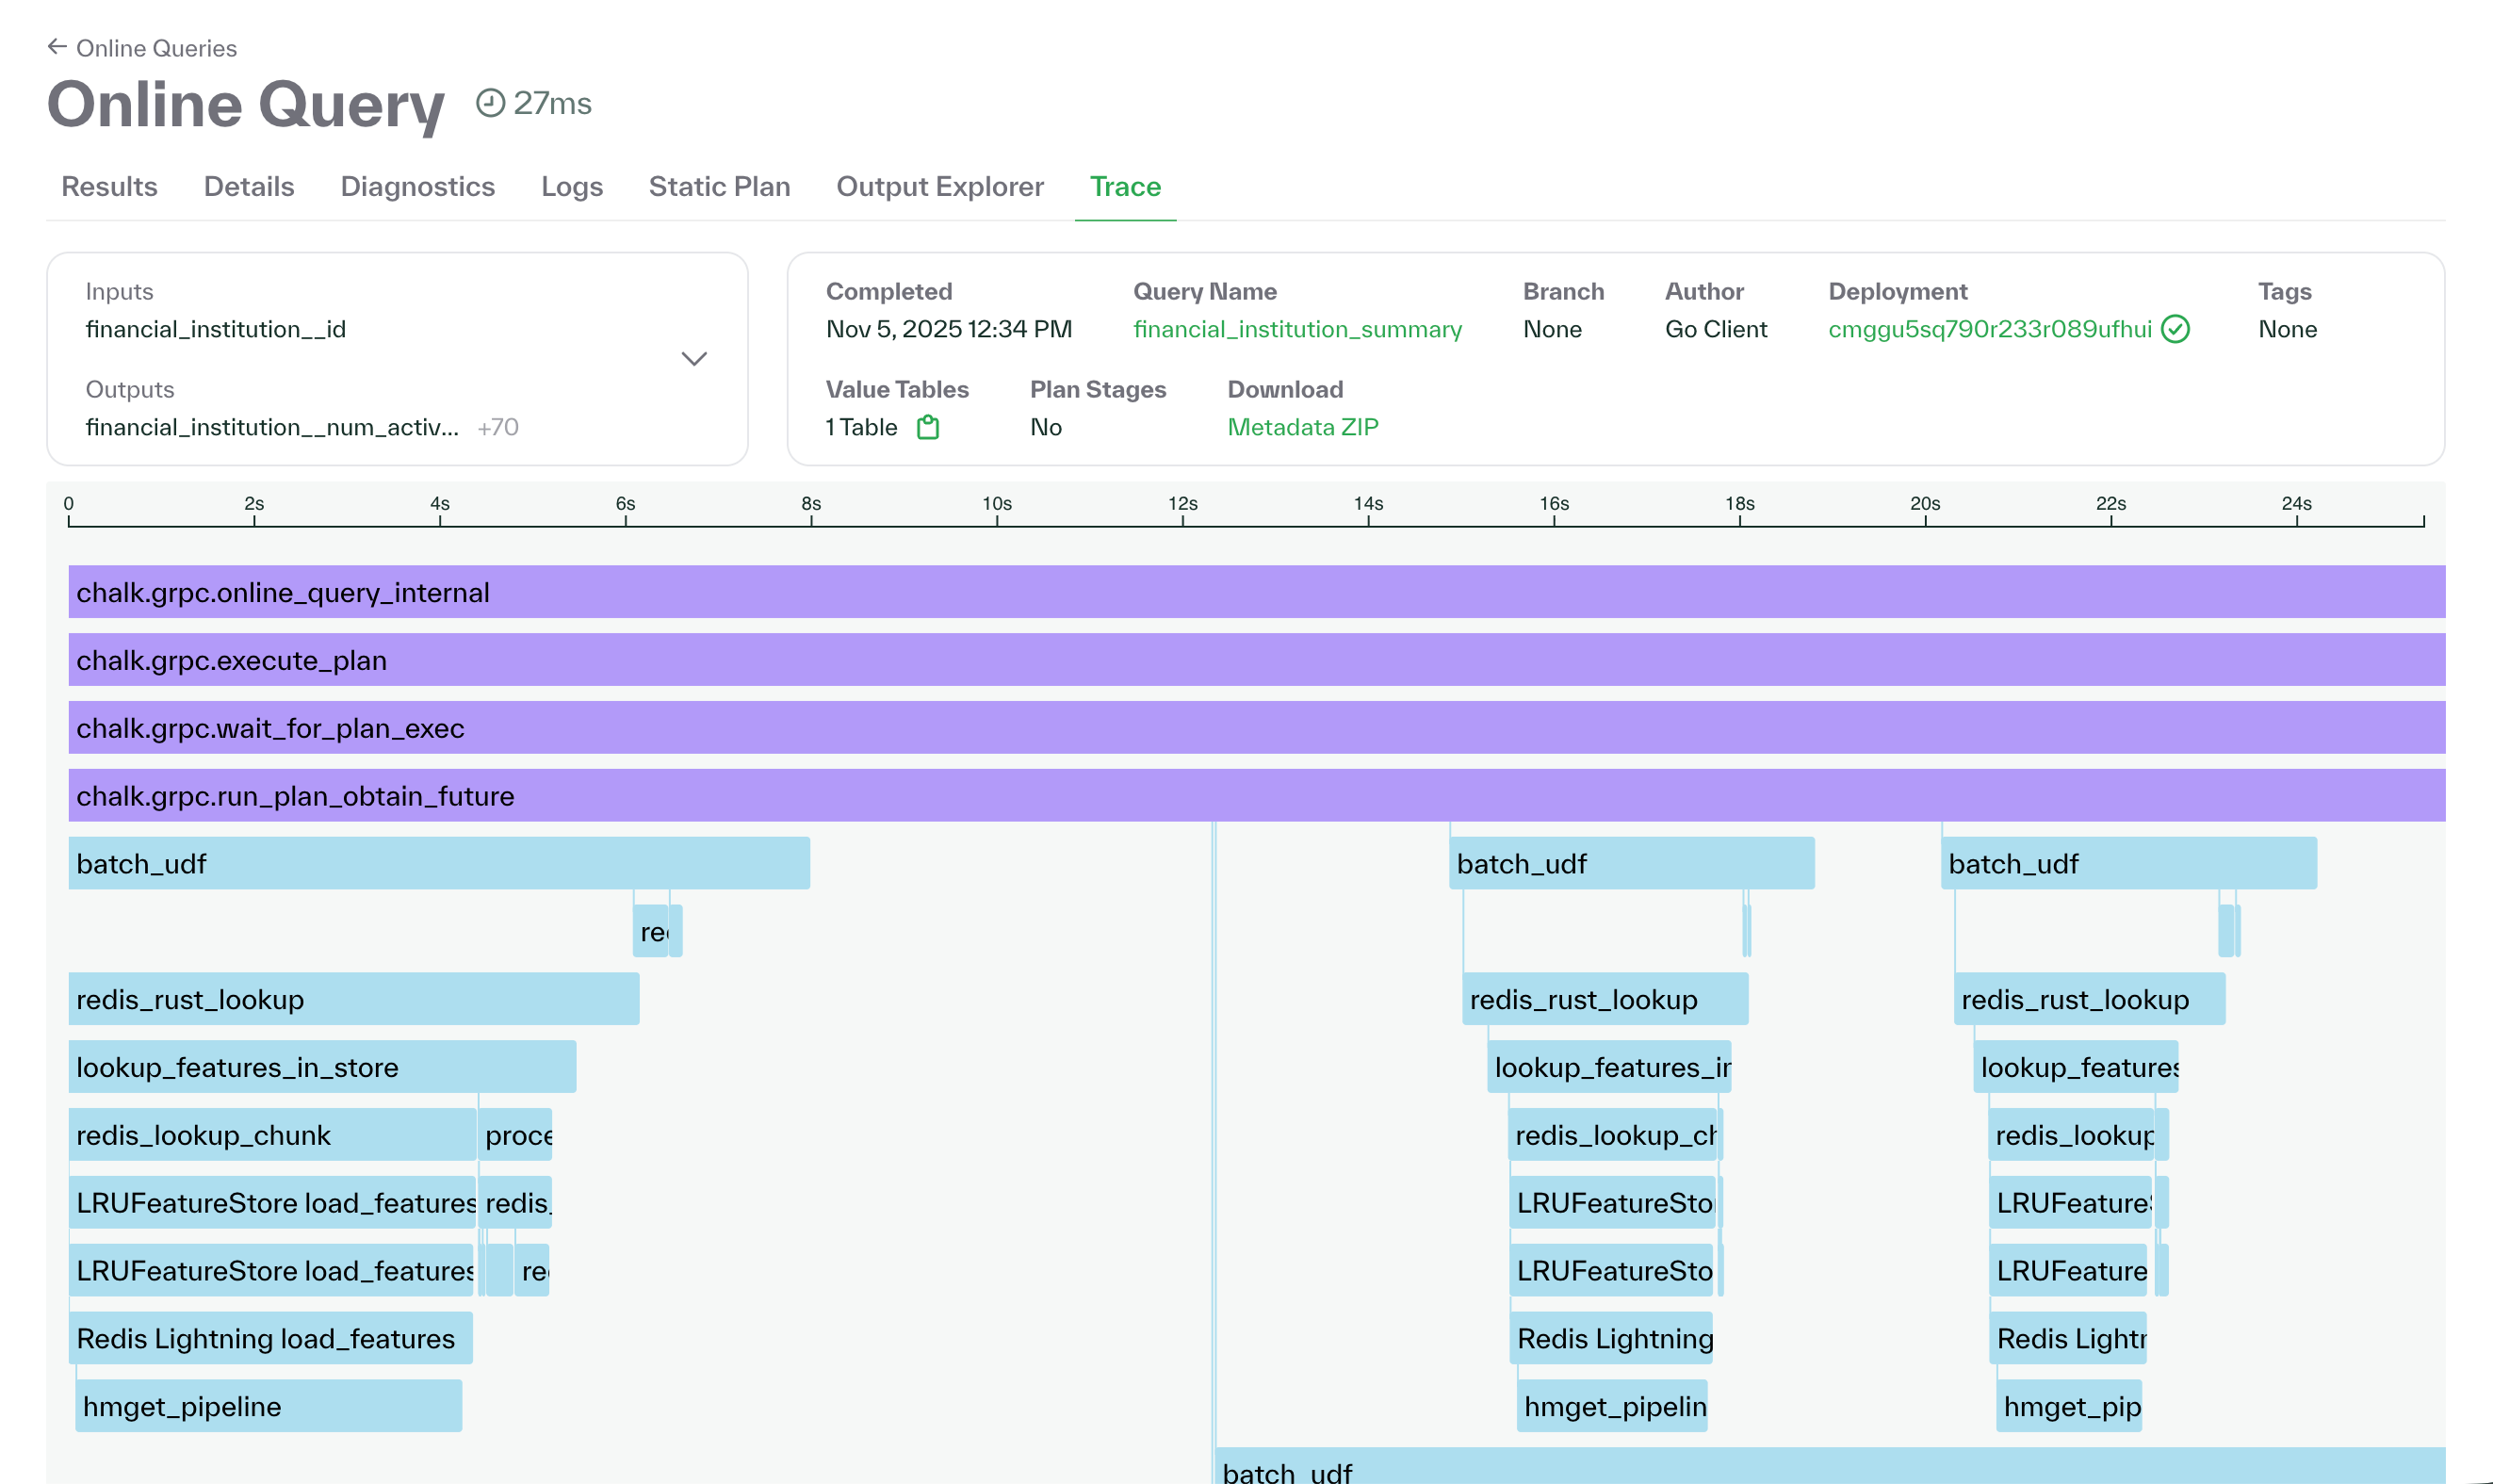
)Once you have run a traced query, you can view the trace in the Trace tab of the Online Query page.
Environment Configuration
Following OpenTelemetry standards,
you can also configure tracing via environment variables. Tracing across your environment can be configured using the
environment variables OTEL_TRACES_SAMPLER and OTEL_TRACES_SAMPLER_ARG, which you can set in your dashboard under
Integrations > Environment Variables. The default values of OTEL_TRACES_SAMPLER=parentbased_traceidratio
and OTEL_TRACES_SAMPLER_ARG=0.01 will be used, unless an explicit value is set
The supported sampling strategies are detailed below:
| Environment Variable Configuration | Description |
|---|---|
OTEL_TRACES_SAMPLER=always_on | Trace 100% of online queries—no query-time overrides |
OTEL_TRACES_SAMPLER=always_off | Disable tracing for all online queries—no query-time overrides |
OTEL_TRACES_SAMPLER=traceidratio OTEL_TRACES_SAMPLER_ARG=0.005 | Sample a percentage of online queries based on OTEL_TRACES_SAMPLER_ARG (e.g., 0.005 for 0.5%)—no query-time overrides |
OTEL_TRACES_SAMPLER=parentbased_traceidratio OTEL_TRACES_SAMPLER_ARG=0.01 | Sample a percentage of online queries based on OTEL_TRACES_SAMPLER_ARG (e.g., 0.01 for 1%) if there is no parent span—accepts query-time overrides |
OTEL_TRACES_SAMPLER=parentbased_always_on | Trace 100% of online queries if there is no parent span—accepts query-time overrides |
OTEL_TRACES_SAMPLER=parentbased_always_off | Disable tracing for all online queries if there is no parent span—accepts query-time overrides |
When configuring tracing via environment variables, you can either enforce tracing settings for all queries
(“alwayson” or “always_off”) or enable query-time overrides (“parentbased*” samplers). For example, if you set
OTEL_TRACES_SAMPLER=parentbased_traceidratio with OTEL_TRACES_SAMPLER_ARG=0.01, then 1% of online queries
will be traced by default, but you can still enable tracing for specific queries using the --trace flag or
the trace=True argument in ChalkClient. However, if you set OTEL_TRACES_SAMPLER=always_on, then all
online queries will be traced, and the query-time flags will be ignored.
Troubleshooting
Traces not showing up, a “ClickHouse server is not currently reachable” error, or a trace waterfall that won’t render? See the Telemetry FAQ for fixes to common telemetry pipeline issues.