Observability
Feature Drift
Detect and setup alerting for drift in feature values
Chalk provides a simple way to monitor feature drift by running the Kolmogorov-Smirnov test for features values over a given time period.
Kolmogorov–Smirnov test
The K-S test is a statistical test that can be used to determine if two samples are drawn from the same distribution. Chalk runs the test on samples from the online store and data from a given dataset to determine if the feature values are drawn from the same distribution.
Note that the K-S test can not be used if the feature values in the dataset are all null, if they are not numeric or if there is only one unique value.
Charts and Alerts
To setup a chart and alert for the Kolmogorov-Smirnov test, start by creating a named dataset for the features you want to monitor.
Then under Alerting > Metric Charts, create a new chart and click on Add Formula, choosing KS TEST as the function. Next select the dataset you created and the feature you want to monitor.
The y-axis of the chart displays the difference between the Kolmogorov-Smirnov test statistic and the critical value at significance level 0.05. When the value is greater than 0, the feature values are considered to be drawn from different distributions.
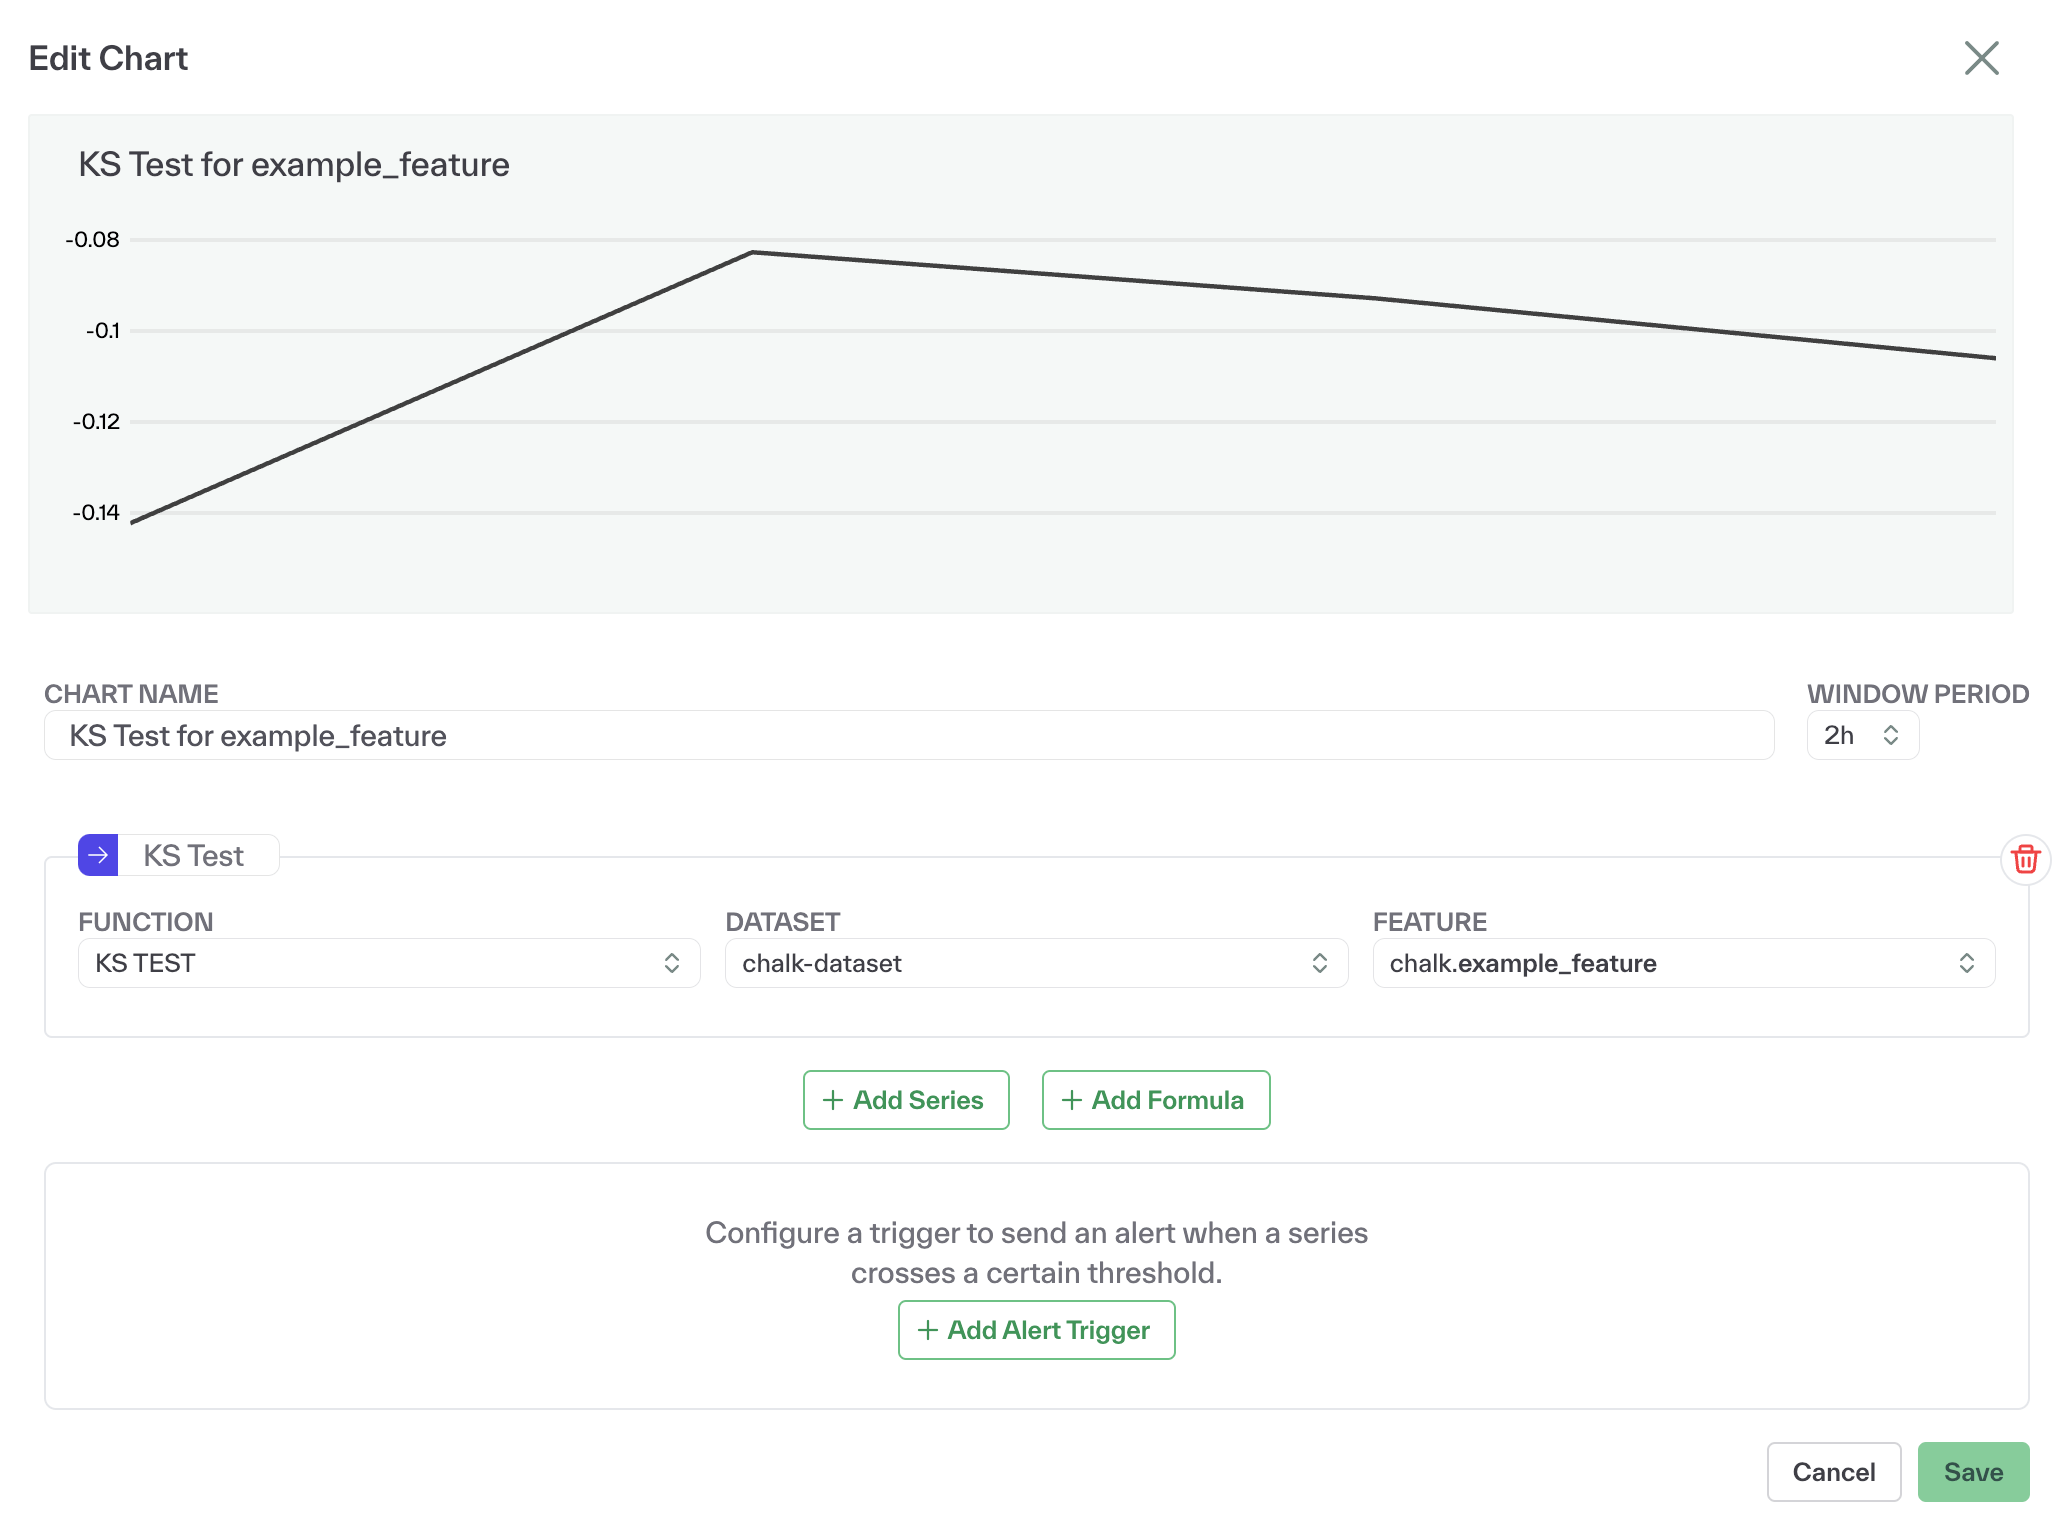
To create an Alert, click on Add Alert Trigger and configure the alert to trigger when the KS Test value is greater than 0.