- Observability
- Metrics Monitor
Observability
Metrics Monitor
Define and monitor metrics
Chalk’s online dashboard provides a simple way to view metrics about performance of your queries resolvers. By default, the resolver and query detail pages show request count and latency for each 30 minute interval over the last 2 days, but you may wish to customize this to make it more useful.
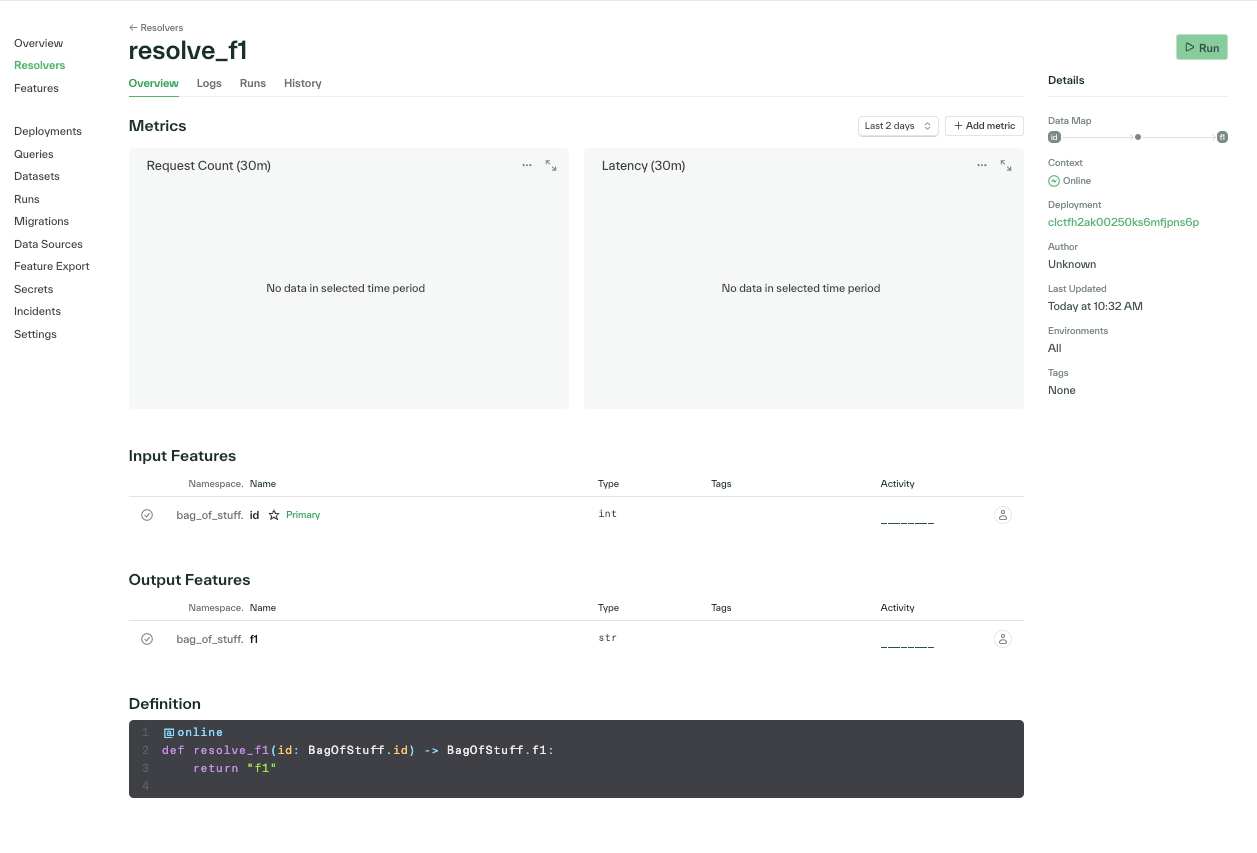
Resolver Details
In addition to the default charts, the resolver details page tells you the input and output features of the resolver, plus the implementation code of the resolver.
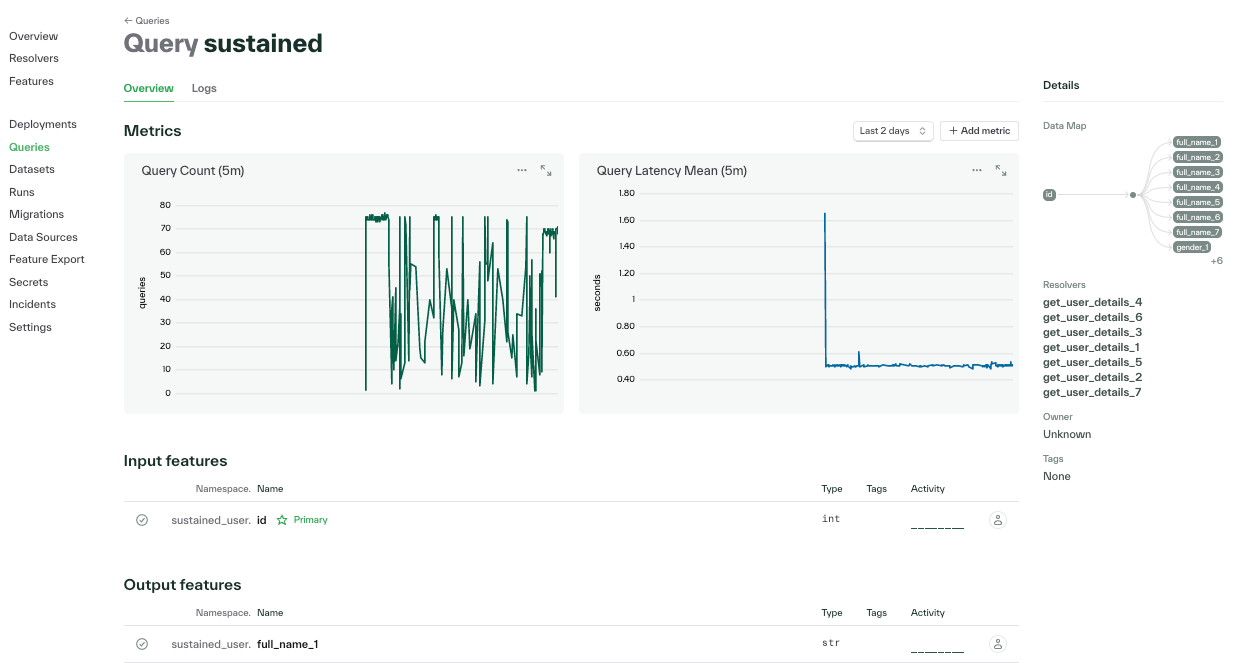
Query Details
The query details page shows you much of the same information as the resolver details page, including the input and output features. You can also see which resolvers executed on the right hand sidebar.
Customize Your Metrics Dashboard
Customize your monitoring view with additional charts, combine metrics into complex formulas, and configure alerting thresholds. Clicking “Add Metric” brings up the metric editor which you can use to add a new chart to your page. Edit or remove a chart using the ellipsis menu.
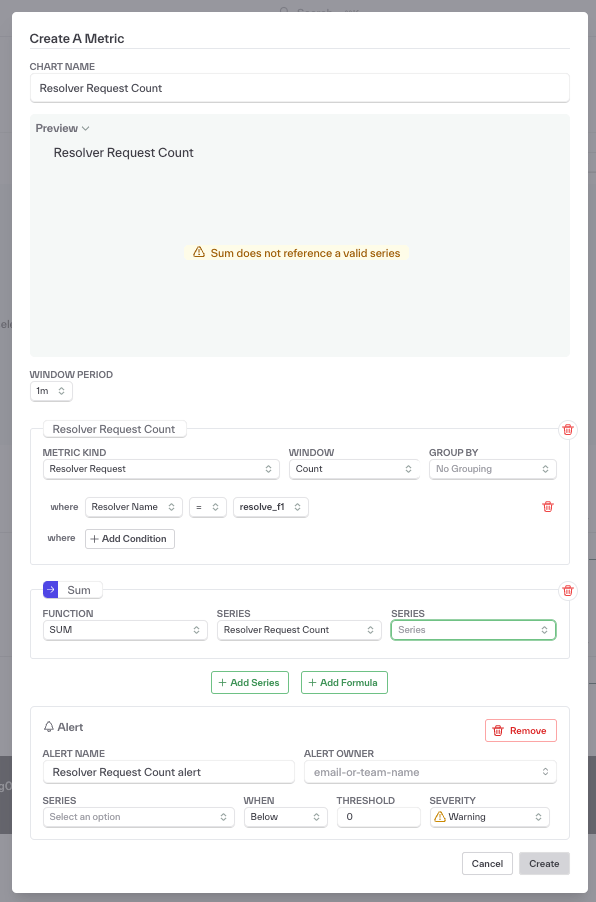
Add Series
By default, when you click add metric the editor is pre-populated with a new series called Request Count. Use the drop down fields to change the metric kind, window, grouping function, and conditions. Add additional series to the chart by clicking “Add Series” below.
Add Formula
Aggregate multiple series together into one chart using a formula. Chalk supports aggregating by sum, total ratio, ratio, product, and abs
Add Alert Trigger
Alerts can be triggered on any series or formula. To set up an alert, you should first configure at least one of a Pagerduty integration or a Slack integration. Then you can set up Alert Configurations to define which channels to use to alert different users or teams. Then, in your metrics chart, you can select the series, the threshold logic, and the severity, and route the alert appropriately with the alert owner dropdown. You can select from users in the Chalk environment or free type an owner name corresponding to one of your alert configurations.